Learn
Learn more
Learn more

Learn more
Learn more
Learn more
Learn more
Indicators & oscillators
Common trading terminology explained so you can embark on your trading journey with confidence.

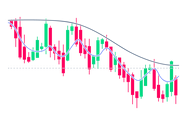
Beginners guide to moving averages
Learn to identify price reversals in markets using moving averages.

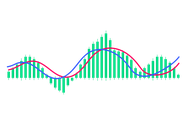
MACD: Finding entry and exit points
Use the MACD indicator (oscillator) to identify potential entry and exit points in the financial markets.

Beginners guide to Fibonacci retracements
Learn to identify price reversals in markets using Fibonacci retracements.
Beginners guide to the RSI
Using the relative strength index to identify overbought and oversold areas of a security’s price in the markets.
How to trade with Bollinger Bands®
Bollinger Bands, a technical indicator that measures market's volatility and identifies overbought and oversold conditions
How to use stochastic oscillator
Learn how to identify trend reversals in the market using the stochastic oscillator.